Introduction
Non-pharmaceutical interventions (NPIs) can complement traditional vaccination and anti-viral medications for infectious disease. NPIs are particularly significant for diseases like influenza, which have not shown to be well managed by vaccination alone. Worldwide, annual influenza epidemics are estimated to infect 5–10% of adults and 20–30% of children resulting in 3 to 5 million cases of severe illness and 250,000 to 500,000 deaths[1]. These infections account for 10% of global respiratory hospitalizations in children under 18 years of age[2]. Direct medical costs (2015) for influenza for inpatient care have been estimated at $3,650- $9,660 per case (reviewed in[3]) and a total economic burden of influenza exceeding $87 billion per year in the USA[4]. In Minnesota (MN), USA, the 2014–15 influenza season was especially severe with 4,202 people hospitalized with laboratory-confirmed influenza infection and 10 confirmed pediatric influenza-related deaths. This was the highest rate reported for the past six seasons including the H1N1 influenza pandemic in 2009[5]. Influenza and respiratory syncytial virus (RSV) accounted for over 50% of hospitalizations (all ages) from respiratory infections with an additional 706 outbreaks of influenza-like illness (ILI) reported in schools[5]. This increase in influenza was attributed to antigenic drift, leaving the vaccine largely ineffective. The 2014–15 influenza season illustrates why alternative approaches such as NPIs could prove to be valuable in disease prevention.
The probability for influenza virus transmission increases in situations where many people are in enclosed spaces and in close proximity such as airplanes and naval ships[6]. Children play a critical role in the transmission of acute respiratory infections within a community[7]. Survival and transmission of influenza virus may be impacted by the droplet size of airborne influenza. Larger droplets settle out of air at a more rapid rate, and do not penetrate as deep into the respiratory tract to seed infection[8]. Under laboratory conditions, others have shown that infectious influenza virus can persist from hours to days (17 days on banknotes with respiratory secretions[9]) in objects as varied as surface dust[10], cloth, pillow case, soft fabric toy, light switch material, formica, vinyl, and stainless steel[11, 12]. Researchers have demonstrated transfer of infectious influenza A virus from stainless steel surfaces (up to 24 hours) or from paper tissues (15 minutes) to hands, while remaining infectious on hands for 5[13] - 60[12] minutes.
The mortality and transmission rates of influenza A virus have been associated with decreased absolute humidity (AH) [14]. This epidemiological correlation suggests that deliberate increases in AH could be a potential NPI to reduce the spread of influenza and other viruses. One approach is to maintain relative humidity (RH) between 40–60%, the proposed optimal range for reducing growth opportunities for viruses, bacteria, and fungi[15]. Our previous study, demonstrated that classroom humidification to RH of 40–60% may be a feasible approach to increase indoor AH to levels with the potential to reduce influenza virus survival (a target of 10mb) and transmission as predicted by modeling analyses[16].
Community schools are promising locations for potential use of humidity as a NPI due to the role of children as a key source of influenza virus transmission from the community into a household[4]. We developed a novel in-school sampling process (S1 Fig) sensitive enough to detect influenza virus presence, quantity (viral RNA), and infectivity.
Outside of the laboratory, no prior studies have tested the potential for humidification to serve as an NPI. A few groups have succeeded in collecting influenza virus (RNA) from air samples in health care settings[17, 18]. One group also detected influenza virus (RNA) within air samples at a day-care facility (babies’ and toddlers’ rooms) and on board airplanes across the USA[18]. However, these studies did not detect and isolate infectious influenza from fomites in field conditions. This study investigated the presence and infectivity of influenza A virus in active preschool classrooms under control and humidified conditions.
 Fig 1. Absolute humidity and influenza hospitalized cases.
(A) Outdoor absolute humidity (AH) values (n = 65; one measurement per day) from Rochester, MN and influenza hospitalized cases in MN (n = 1070, week ending in January 16th- March 19th). Applying the national trend model described by Shaman et al.[34] to the local humidity and illnesses, onset of influenza followed the predicted delay of 10–16 days (grey box) after an absolute humidity trough (blue box). Peak cases follow (pink box), as there is an incubation period of 1–4 days with viral shedding up to 7 days after symptoms resolve.
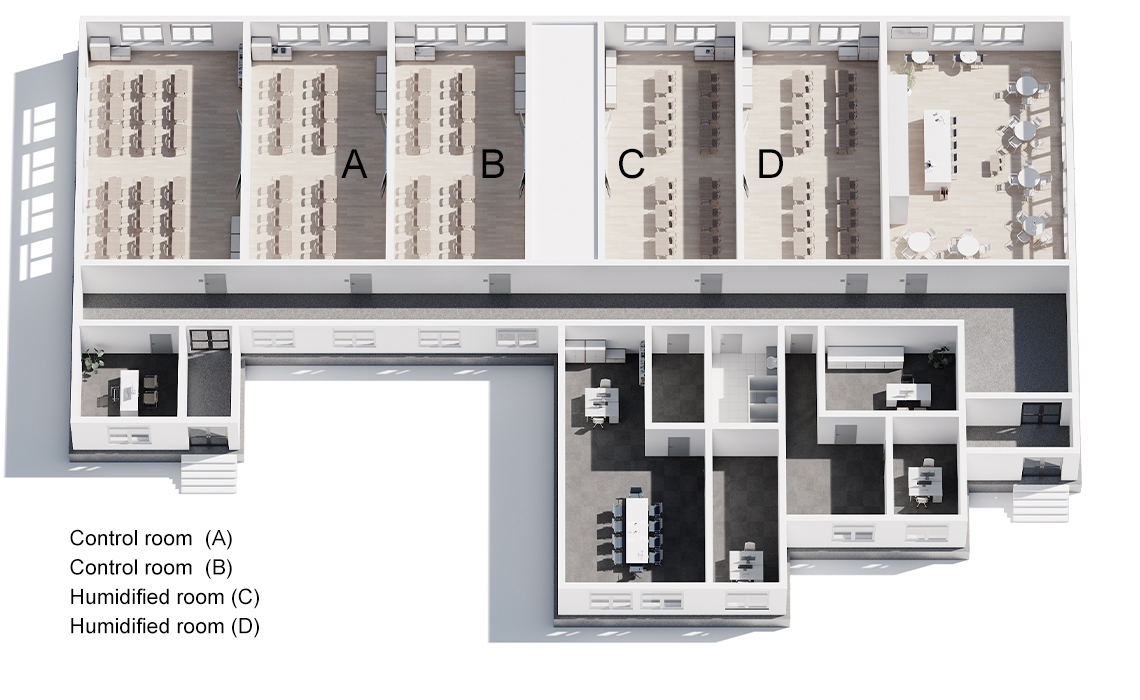
(B) AH in 4 preschool classrooms (average of two sensors from 10 minute intervals over 150 minutes (n = 16 per sensor, room D) or (n = 17 per sensor, rooms A,B, C) per class period per sensor). Center values are mean of both sensors during class time and error bars are s.d. and corresponding outdoor AH (n = 15, 1 per day) on the 15 days of sample collection. Humidifiers were running in humidified rooms through sample collection on February 23.
Results
At the end of the 2015–16 influenza season, an analysis of MN hospitalizations attributed to influenza virus (data supplied by MN Department of Health via FluSurv-NET)[19] revealed three troughs in atmospheric absolute humidity with the largest one (February 14, 2016)[20] preceding the peak of the seasonal influenza outbreak (Fig 1A). The peak for confirmed hospitalized influenza virus cases (confirmed positive) was the week ending March 12, 2016.
Elevated classroom humidification was maintained at an average of 9.89 mb in humidified rooms compared to 6.33 mb in control rooms (January 25 through February 23). AH was targeted near 10 mb based on previously demonstrated achievable levels in classrooms with a classroom humidifier running in winter [16]. We found that indoor school AH often reached 10 mb and 60% RH during late spring and early fall [16] and calculated 1-hour influenza virus survival of 35% (down from 75% of lowest measured AH of 2.67 mb). Student absences during the study period are presented in Table 1, followed by the samples positive for influenza A virus in Table 2.
|
Control classroom |
Humid classroom |
| Absence category |
% out |
Total Attendance |
% out |
Total Attendance |
| General |
9,17 |
1788 |
8,37 |
2293 |
| Sick |
1,29 |
1788 |
1,00 |
2293 |
| Flu-like illness |
0,39 |
1788 |
0,13 |
2293 |
Tabel 1
Total attendance is the number of students enrolled in control or humidified classrooms multiplied by the total number of school days. % Absence for general means that the students are gone for all reasons (illness, flu-like illness, vacation) divided by the total attendance. % Sick absence represents students who were absent from class due to an explicit illness divided by the total attendance. % Influenza-like Disease Failure indicates the student had self-reported symptoms of fever plus cough or fever plus sore throat. Statistical analyzes are not carried out due to small samples of absences.
|
Control classroom |
Humidified classroom |
Control- vs. Humidified classroom |
| Sample-Type |
Assay |
% positive |
n |
% positive |
n |
OR, [95% CI], P > |z| |
Mixed
(fomites and air) |
Electrical impedance |
48,1 |
27 |
16,7 |
18 |
LCSα |
Mixed
(fomites and air) |
PCR |
20 |
320 |
14,5 |
330 |
LCSα |
| Fomites |
PCR |
22,1 |
140 |
18 |
150 |
0,51, [0,33-0,78], 0,002 |
| Air (total) |
PCR |
18,3 |
180 |
11,7 |
180 |
0,51, [0,29-0,89], 0,20 |
| Air < 1 µm |
PCR |
13,3 |
60 |
10 |
60 |
1,25, [0,91-1,72], 0,174 |
| Air 1-4 µm |
PCR |
25 |
60 |
16,7 |
60 |
0,48, [0,16-1,42], 0,183 |
| Air > 4 µm |
PCR |
16,7 |
60 |
8,3 |
60 |
0,51, [0,23-1,10], 0,087 |
Tabel 2
The percentage positive was calculated by dividing the number of positive samples by the number of samples taken under these conditions. The sample number (s) is indicated. Samples tested by PCR included all carrier and air samples and are combined and divided into carrier and air categories (overall). In addition, air samples were separated into the three sizes of air particles collected. Statistical analyzes of OR, 95% CI and P>|z| are given. α indicates a low cell size (LCS), so statistical analyzes are not carried out due to the small sample size.
A total of 650 samples were collected (320 in control rooms, 330 in humidified rooms) of which 112 (17%) were positive for influenza A virus by RT-PCR (Table 2, S2 Fig). There were fewer influenza A virus positive samples in humidified rooms compared to control rooms for both fomites and for total air. However, when individual sizes of air particles were examined, differences did not achieve statistical significance. The distribution of influenza A virus positive samples within the different sizes of air particles varied with the greatest percentage of positive samples within the 1–4 μm size for both control and humidified rooms (Table 2).
Quantitative RT-PCR of influenza A virus for genome copy number revealed a significant reduction in mean copy number in humidified rooms compared to controls for fomites (P<0.001) and air (total) (P<0.001) (Fig 2A). The mean influenza A genomic copies per sample for humidified rooms was 24.6 compared to 34.5 for control rooms for fomites. For air (total) the mean influenza A genomic copies per cubic meter of air was 36.1 for humidified rooms compared to 79.1 for control rooms (Fig 2B). Review of qRT-PCR data at individual particle sizes revealed that air <1 μm (P = 0.010), and air > 4 μm (P = 0.011) experienced a significant reduction in influenza A virus mean genomic copies. This difference is displayed both as measured genomic copy number and as a calculated copy number per estimated air volume in S1 Table. Mean influenza A virus genome copies for air between 1–4 μm (P = 0.208) trended lower in humidified rooms but was not statistically different from control rooms at a 95% CI. Influenza A virus genome copies varied among different sample types with fomites having the highest copy number followed by air 1–4 μm particles (S1 Table). The electrical impedance assay has been used by other groups [21, 22] for assessing influenza A infectivity and for other viral infections [23, 24]. The instrument measures cell index as a read out of cell adherence, viability, and growth. When there are no cells present, the cell index is zero (as calibrated with wells containing plain media) and once the cells are seeded, attach and grow, the cell index increases. Electrical impedance assay revealed 35.6% of RT-PCR positive classroom samples tested to be infectious (Table 2 and S3 Fig). There were a smaller percentage of infectious samples from the humidified rooms (3 of 16 tested, 19%) than the control rooms (13 of 16 tested, 81%).
 Fig 2. Influenza A virus genomic copies of positive samples.
Horizontal bars indicate mean copy number and error bars are 95% CI. Fomites control, n = 31; Fomites humidified, n = 27; Air (total) control, n = 33; Air (total) humidified, n = 21. * Indicates air samples calculated mean per cubic meter of air based on air sample volume. * P<0.001.
The majority of air particles were less than 1μm size for both humidified and control rooms. Average particle concentrations (counts per cubic centimeter of air) decreased with increasing size in all four classrooms, irrespective of humidification status (Fig 3). Particles generated from the humidifier and the average counts from 7 independent measurements over a 22-minute period showed more than 96% of the particles provided by humidification were less than 1 μm. Humidified rooms showed a near doubling of both 1–4 μm, and >4 μm air particles (Fig 3). There were a significant increase in the population of larger sized particles (1–4 μm and >4 μm) in the humidified versus control rooms (Fig 3). This observation supports the hypothesis of droplet combination of the small particles added by humidification with present (and potentially influenza-bearing) particles. Larger particles remain airborne for less time (4 μm takes 33 minutes to settle 1 meter in still air versus 1 μm takes 8 hours)[17] and are unable to reach as deep within airways so are thought to be less pathogenic[8].
From January 25- March 11, 2016, 10 influenza-like illnesses (ILI) from absent students were recorded by school personnel (Table 1). Seven of these absences were from control (non-humidified) rooms and three were from humidified rooms. Both sets of rooms (control and humidified) had the same number of absences due to illness (23) overall. The differences in copy and infectivity are normalized to the number of positive samples. As shown in Table 2, in a per-room comparison of humidified and control rooms the % positive (# PCR+ /total samples per room), % infective (# positive by infectivity/ # PCR positive tested per room), and in Table 1 the % of students with ILI absences (# students with fever + cough or fever + sore throat / total student attendance by classroom during study) all were lower in humidified rooms than control rooms.
Discussion
This study monitored presence, genomic copy number, and infectivity of influenza A virus in preschool classrooms during the dry winter months (low indoor humidity), which correspond with peak respiratory virus infections in Minnesota. An increase in average AH from 6.33 mb in control rooms to 9.89 mb in humidified rooms (RH ~42–45%) was associated with a significant decrease in influenza A virus presence in fomite and air samples in humidified rooms compared to control rooms. Additionally, PCR-positive samples from humidified rooms exhibited lower infectivity than samples from control rooms. It is important to note that this increase in influenza A viral genome copies and decrease in infectivity is shown normalized to the number of positive samples to eliminate the potential to interpret the increased copy number and infectivity as a simple expression of the number of sick children. The decrease in infectivity could be driven by a lower viral load of the PCR-positive humidified room samples as compared to PCR-positive control room samples. This correlates with the lower genome copies of influenza A virus PCR positive samples observed in humidified rooms. Enveloped viruses such as influenza are less stable in the environment than non-enveloped viruses and are more sensitive to higher relative humidity[25–27]. The exact mechanism underlying the action of humidity on the survival of the influenza virus is still not fully understood[28]. Several studies have hypothesized that surface inactivation for viruses with structural lipids may be due to denaturing of the lipoproteins found in enveloped viruses and phase changes in the phospholipid bilayer leading to cross-linking of associated proteins[25]. Additionally, relative humidity impacts the salt concentration within droplets and at low relative humidity (<50%), the solutes crystalize and influenza virus viability was maintained[29].
Prior studies have largely focused on the influence of humidity (RH or AH) on influenza virus survival under laboratory conditions ([8, 27–30]). One study modeled influenza virus survival across varied ranges of ambient indoor AH and humidification levels achievable in school environments[16]. Based on these findings, we hypothesized that classroom humidification might be a feasible approach to increase indoor AH to levels that could decrease influenza virus survival and transmission. Taking classroom humidification the next step further we included collection of samples from classroom environments and demonstrated that humidified rooms exhibited fewer influenza A virus-positive samples and reduced genomic copies. Additionally, influenza A virus-positive samples were less infectious in humidified rooms. Together, these outcomes strongly support the hypothesis that deliberate humidification can mitigate influenza A virus activity in a school environment.
In this study, humidifiers significantly increased the overall amount of particles, especially by increasing number of small air particles, leading to an increase in larger size particles, and rendering a shift in distribution towards largest particles, >4 μm. This could be attributed to the aggregation of particles in the humidified air, reducing the time of air suspension and transmission via inhalation (Fig 3). These findings enable a better understanding of the impact of humidity on influenza A virus survival (surfaces and objects) as well as virus transmissibility via aerosols by measuring the size of aerosol particles and the distribution of viruses within different sizes of particles.
 Fig 3. Air particle concentrations by size in classrooms.
Bars indicate mean particle counts per cubic cm of air by size of air particles and error bars are 95% CI. Control, n = 23; Humidified, n = 30. * P <0.05, ** P <0.01.
Adding direct measurements of influenza virus (or other respiratory viruses) in a larger experimental population may reveal higher resolution outcomes to this approach. Furthermore, the impact of exogenous humidification on other viruses will need to be similarly measured to more fully understand the full potential impact of this NPI on other sources of communicable respiratory infections.


