Studie Übertragung von Grippe-Viren durch die Luft

Brief summary


Nebulized influenza was coughed into the examination room and Bioaerosol samplers collected size-fractionated aerosols adjacent to the breathing manikin’s mouth and also at other locations within the room. At constant temperature, the RH was varied from 7–73% and infectivity was assessed by the viral plaque assay.

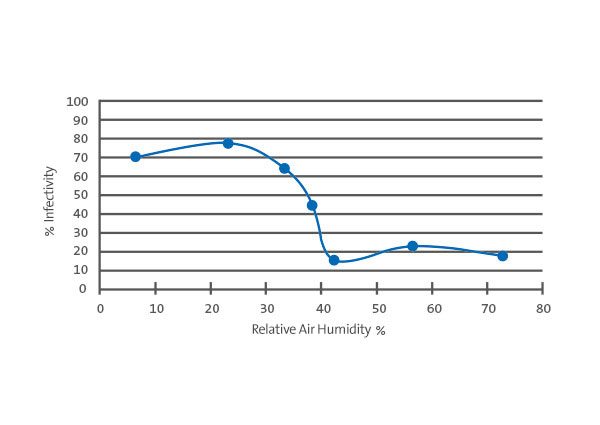
Total virus collected for 60 minutes retained 70.6–77.3% infectivity at relative humidity ≤23% but only 14.6–22.2% at relative humidity ≥43%. Analysis of the individual aerosol fractions showed a similar loss in infectivity among the fractions. Time interval analysis showed that most of the loss in infectivity within each aerosol fraction occurred 0–15 minutes after coughing. Thereafter, losses in infectivity continued up to 5 hours after coughing, however, the rate of decline at 45% relative humidity was not statistically different than that at 20% regardless of the aerosol fraction analyzed.


Further information

Winter influenza outbreaks occur with seasonal regularity in temperate climates. During the winter, people spend the majority of their time indoors and the risk of aerosol transmission of influenza by coughing, sneezing and breathing is a concern because respirable particles carrying influenza may remain airborne for prolonged periods.

Healthcare workers treating influenza patients are particularly prone to infection as they can be exposed to multiple patients in closed examination rooms over the course of a day. To address whether humidity contributes to the risk of aerosol transmission of influenza, a simulated examination room equipped with environmental controls was constructed that contained a coughing and breathing manikin. The influenza virus was coughed into the examination room, in which a relative humidity of 7 to 73% was set. In this study, the virus collected at the breathing manikin was separated into 3 size fractions according to their aerodynamic diameters (>4 μm, 1–4 μm, and <1 μm).


Results

High Humidity Reduces the Infectivity of Influenza. At medium relative humidity, 60 to 80% of the virus is inactivated in the first hour. The infectivity was lowest at 43% relative humidity. Under these conditions it was only 15%. At 7 to 23% relative humidity, 77% percent of the viruses retained their infectivity, before and after coughing up. At low relative humidity, the infectivity of viruses from a particle fraction decreases only slightly within the first hour.


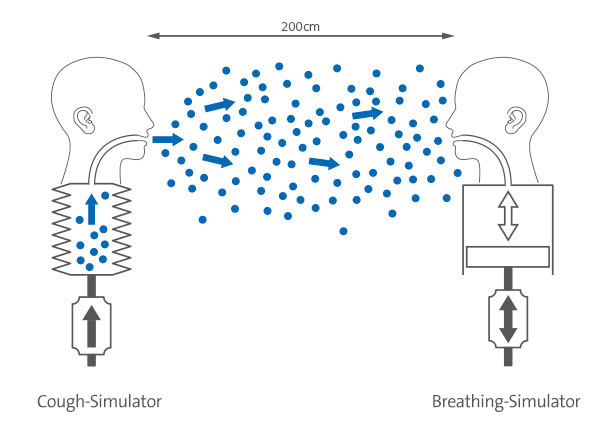
Hust- und Atmungs Simulator

Cough simulator

The National Institute of Safety and Health (NIOSH) collected aerosols by mouth, 10 cm on both sides of the doll‘s mouth as shown. The mouths of the cough and breath simulators were 152 cm above the floor (approximate mouth height of a patient sitting on a table and a standing medical Employee).


Study by Dr. John D. Noti


Winter influenza outbreaks occur with seasonal regularity in temperate climates and it has been suggested that humidity may affect transmission [1], [2]. Previous studies using influenza aerosols in small settling chambers generally concluded that aerosolized virus was inactivated at high relative humidity (RH) but survived much better at low RH [3], [4], [5]. Other studies [6], [7] revealed that survival was optimum at low RH, moderate at high RH and minimum at middle RH.

The aerodynamic diameters of the aerosolized particles were not determined in any of these studies; therefore, the influence of particle size on inactivation of virus has not been reported. Lowen et al. [8] used a guinea pig model to directly test whether humidity affected aerosol transmission of influenza from infected animals to uninfected animals, housed in adjacent but separate cages in an environmental chamber with five RHs ranging from 20–80% at 20°C. In their study, transmission rates were 75–100% at 20%, 35%, and 65% RH, but only 25% at 50% RH and 0% at 80% RH. However, air samples were not collected to confirm that guinea pigs housed at different RHs shed similar amounts of aerosolized virus.

During the winter, people spend the majority of their time indoors and the risk of aerosol transmission of influenza by coughing, sneezing and breathing is a concern because respirable particles carrying influenza may remain airborne for prolonged periods. Influenza RNA has been detected in the exhaled breath and coughs of patients with influenza [9]–[11] and clinical studies during influenza seasons indicated that influenza was detected in aerosol particles ≤4 μm [12], [13]. A recent study of indoor locations where jet travelers are likely to interact with locals determined that RH is one of the primary factors associated with aerosol transmission of influenza [14].

Healthcare workers treating influenza patients are particularly prone to infection as they can be exposed to multiple patients in closed examination rooms over the course of a day. A novel approach to assess risk factors is the use of manikins in a controlled environment. This approach has been used to study the flow of human respired air in a room [15], the effects of ventilation on respired air [16]–[18], and the efficacy of surgical masks and respirators for protection of healthcare workers exposed to coughed influenza aerosols [19], [20].

To address whether humidity contributes to the risk of aerosol transmission of influenza, a simulated examination room equipped with environmental controls was constructed that contained a coughing and breathing manikin to simulate a healthcare worker’s exposure [19], [20]. In this study, the virus collected at the breathing manikin was separated into 3 size fractions according to their aerodynamic diameters. We show that at low RH there is little loss in infectivity of virus from any particle fraction within the first hour but at moderate RH, 60–80% of the virus is inactivated and is dependent on viral particle size. The fastest rate of inactivation was seen in the >4 μm particle size where 78% of infectivity was reduced within 16–30 minutes of a cough.

Cells and Virus

Madin-Darby canine kidney (MDCK) cells (ATCC CCL-34) and Influenza strain A/WS/33 (H1N1, ATCC VR-825) were purchased from the American Type Culture Collection (ATCC, Manassas, VA) and maintained as described [21].

Bioaerosol Samplers
National Institute for Occupational Safety and Health (NIOSH) bioaerosol samplers, which collect and size-fractionate aerosols into three fractions (> 4 μm, 1–4 μm, and < 1 μm aerodynamic diameters), were used to collect influenza-containing aerosols [12], [22].

Real-time qPCR
The amount of total virus (infectious and non-infectious) in an aerosol sample was determined by real-time qPCR analysis to assess the number of Matrix1 gene copies as described [21].

Viral Plaque Assay (VPA)
The number of infectious virus within an aerosol sample was determined by the VPA. Aerosols containing infectious influenza were inoculated onto a confluent lawn of MDCK cells and plaque forming units (PFU) were calculated as described [21].

Aerosol Exposure Simulation Chamber
The simulated examination room (aerosol exposure simulation chamber) is 3.16 m×3.16 m×2.27 m high and includes a HEPA filter and an ultraviolet lamp [19], [20] to disinfect the chamber. The virus solution was aerosolized with an Aeroneb 2.5–4 μm micropump nebulizer (Aerogen, Galway, Ireland) and loaded into the cough simulator remotely for a total of 5 coughs at approximately 1 minute intervals as described [19], [20], [21]. The coughing simulator uses a metal bellows driven by a computer-controlled linear motor (Model STA2506, Copley Controls, Canton, MA) to reproduce the flow and aerosol pattern of a human cough. The cough had a 4.2 liter volume with a peak flow of 16.9 liters/second and a mean flow of 5.28 liters/ second. The digital breathing simulator (Warwick Technologies Ltd., Warwick, UK) was equipped with a standard medium- sized head form (Sheffield model 189003, ISI Lawrenceville, GA). The breathing waveform was sinusoidal with a flow rate of 32 liters/minute (ISO standard for an adult 1.88 m tall with a mass of 85 kg engaged in moderate work) [23]. The coughing and breathing simulators were synchronized so that each cough was initiated at the start of an inhalation. NIOSH aerosol samplers collected aerosols 1 mm above the manikin’s mouth (through the mouth), 10 cm to the right and left of the mouth, and at two locations (P1 and P3) inside the room. For time course analysis, exam room air samples were collected from 3 samplers positioned outside the room (P2) to enable immediate processing of the collected samples. Aerosol particle concentrations in the exposure chamber were continuously monitored using an optical particle counter (OPC; Model 1.108, Grimm Technologies, Inc., Douglasville, GA) located 55 cm below the mouth of the coughing manikin The cough aerosol output from the cough simulator was measured using a Spraytec aerosol analyzer (Malvern Instruments, Worcestershire, UK).The aerosol exposure simulation chamber (Enviroline walk-in chamber, Norlake, Hudson, WI) maintained the selected temperature and humidity using a desiccant-based industrial dehumidifier (IAT-150-E, Innovative Air Technologies, Covington, GA), a centrifugal atomizer (Norlake), a remote heating/refrigeration system (NAWE150RL-3, Norlake) and a programmable temperature/ humidity controller (CP8L, Norlake). After the chamber equilibrated at the desired temperature and humidity, the environmental control system was shut off and dampers within the system prevent aerosol particle losses in the dehumidifier and the heating/cooling air circulation system. The wall and floor seams of the chamber are sealed tightly with silicone caulk to prevent aerosol particles from leaking. The entrance door has manual locks that push the door tightly against seals that further prevent aerosol leakage during the equilibration and collection periods.

Statistical Methods
The analysis of the number of PFUs induced by viral particles collected from the samplers was generated using SAS/STAT software, Version 9.2 of the SAS system for Windows (SAS Institute, Cary, NC). Data were transformed by calculating the natural log of PFUs prior to analysis to meet the assumptions of the statistical tests (homogeneity of variance). For samples collected for 60 minutes under 7 different RHs, a two-way factorial mixed-model analysis of variance (ANOVA) was performed on RH and fraction. This was done using RH as a numeric independent variable to calculate slopes, as well as a categorical variable to allow comparisons between mean levels of PFUs in each fraction at each RH. A significant interaction in a model with humidity as a numeric variable indicates that the slopes of the lines which plot PFUs as a function of RH are not equal across fractions. The second experiment, which sampled for 15 minute intervals for 60 minutes at 2 different RHs was analyzed with a three-way factorial mixed model ANOVA on RH, time and fraction, each being utilized as class variables. The final experiment which sampled for 60 minutes between hours 4 and 5 following aerosol generation was analyzed using a two-way mixed model ANOVA on RH and fraction. In all analyses, trial was included as a random variable in ‘Proc Mixed’ to account for the lack of independence between fractions in a given trial. Interactions were analyzed by examining simple main effects using the ‘slice’ option. All pairwise comparisons were considered significant at p<0.05.


Results


High Humidity Reduces the Infectivity of Influenza

To assess the effect of humidity on infectivity, influenza virus was coughed into a simulated examination room where the RH was adjusted from 7–73%. The exam room contained coughing and breathing manikins facing each other and positioned 200 cm (∼6.56 ft) apart (Fig. 1). Approximately 1.0×10⁸ total virus was coughed into the exam room which equilibrated to 4.5×10³ total virus/per liter of room air (assessed by qPCR Matrix gene copies).

A particle counter positioned just below the coughing manikin’s mouth showed that the coughed particles optical diameters were largely within the respirable size range (Fig. 2). Most of the virus was recovered in the 1–4 μm aerosol fraction (74.6% ± standard error 1.99%) and < 1 μm fraction (18.5% ± standard error 2.17%); the remainder was detected in the >4 μm fraction (7.5% ± standard error 0.70%). The total amount of virus captured by each sampler was approximately the same regardless of their position within the room (data not shown). Approximately 4.6% of the 4.5×10³ total virus/per liter of room air loaded into the exam room was infectious prior to coughing (assessed by VPA).

The percentage of virus that retained infectivity (number of PFUs/number of qPCR Matrix copies in an aerosol sample) relative to that prior to coughing was determined to be highest (70.6–77.2%) at 7–23% RH with a dramatic drop to the lowest (14.6%) at 43% RH (Fig. 3A). Increasing the RH to 57% resulted in a modest increase in the retention of infectivity (22.2%). A similar pattern of infectivity in response to humidity was observed among the three aerosol fractions when examined after 60 minutes of collection (Fig. 3B–D). Specifically, in each of the 3 fractions there was a significant decline in infectivity as humidity levels increased. However this percentage decrease in infectivity as a function of humidity occurs to similar extent across the 3 fractions as the 3 slopes are not significantly different from one another.
Comment from
Dr. med. Walter J. Hugentobler


„This recent study showed that humidity in the range of 40 -60%RH had a detrimental effect on the airborne influenza virus, rapidly rendering it harmless. It reinforces the lower level of humidity in public and commercial premises ought to be maintained at above 40%RH to reduce airborne infection.

This is particularly true in environments like doctor‘s surgeries, hospitals and health care facilities where there are a greater number of infected individuals and others who are especially vulnerable. The critical humidity level of 40 to 45%RH as lower limit has been reinforced over decades of research in countless studies. “


Sources


Original title: High humidity leads to loss of infectious influenza virus from simulated coughs

Source link: http://dx.plos.org/10.1371/journal.pone.0057485

Released: 27. February 2013


1. Shaman J, Pitzer VE, Viboud C, Grenfell BT, Lipsitch M (2010) Absolute humidity and the seasonal onset of influenza in the continental United States. PLoS Biol 8(2): e1000316.
2. Shaman J, Goldstein E, Lipsitch M (2011) Absolute humidity and pandemic versus epidemic influenza. Am J Epidemiol 173: 127–135.
3. Hemmes JH, Winkler KC, Kool SM (1960) Virus survival as a seasonal factor in influenza and poliomyelitis. Nature 188: 430–431.
4. Hood AM (1963) Infectivity of influenza virus aerosols. J Hyg, Camb 61: 331– 335.
5. Harper GJ (1961) Airborne micro-organisms: survival tests with four viruses. J Hyg, Camb 59: 479–486.
6. Shechmeister IL (1950) Studies on the experimental epidemiology of respiratory infections. III. Certain aspects of the behavior of type A influenza virus as an airborne cloud. J Inf Dis 87: 128–132.
7. Schaffer FL, Soergel ME, Straube DC (1976) Survival of airborne influenza virus: effects of propagating host, relative humidity, and composition of spray fluids, Arch Virol 51: 263–273.
8. Lowen AC, Mubareka S, Steel J, Palese P (2007) Influenza virus transmission is dependent on relative humidity and temperature. PLoS Pathog 3(10): 1470– 1476.
9. Fabian P, McDevitt J, DeHaan W (2008) Influenza virus in human exhaled breath: An observational study. PLoS ONE 3: e2691.
10. Huynh KN, Oliver BG, Stelzer S, Rawlinson WD, Tovey ER (2008) A new method for sampling and detection of exhaled respiratory virus aerosols. Clin Infect Dis 46: 93–95.
11. Stelzer-Braid S, Oliver BG, Blazey AJ, Argent E, Newsome TP, et al. (2009) Exhalation of respiratory viruses by breathing, coughing, and talking. J Med Virol 81: 1674–1679.
12. Blachere FM, Lindsley WG, Pearce TA, Anderson SE, Fisher M, et al. (2009) Measurement of airborne influenza in a hospital emergency department. Clin Infect Dis 48: 438–440.
13. Lindsley WG, Blachere FM, Davis KA, Pearce TA, Fisher MA, et al. (2010) Distribution of airborne influenza virus and respiratory syncytial virus in an urgent care medical clinic. Clin Infect Dis 50: 693–698.
14. Hanley BP, Borup B (2010) Aerosol influenza transmission risk contours: A study of humid tropics versus winter temperate zone. Virol J 7: 98.
15. Bjorn E, Nielsen PV (2002) Dispersal of exhaled air and personal exposure in displacement ventilated rooms. Indoor Air 12: 147–164.
16. Qian H, Li Y, Nielsen PV, Hyldgaard CE, Wong TW, et al. (2006) Dispersion of exhaled droplet nuclei in a two-bed hospital ward with three different ventilation systems. Indoor Air 16: 111–128.
17. Qian H, Li Y (2010) Removal of exhaled particles by ventilation and deposition in a multibed airborne infection isolation room. Indoor Air 20: 284–297.
18. Pantelic J, Sze-To GN, Tham KW, Chao CYH, Khoo YCM (2009) Personalized ventilation as a control measure for airborne transmissible disease spread. J R Soc Interface 6: S715–S726.
19. Noti JD, Lindsley WG, Blachere FM, Cao G, Kashon ML, et al. (2012) Detection of infectious influenza virus in cough aerosols generated in a simulated patient examination room. Clin Infect Dis 54: 1569–1577.
20. Lindsley WG, King WP, Thewlis RE, Reynolds JS, Panday K, et al. (2012) Dispersion and exposure to a cough-generated Aerosol in a Simulated Medical Examination Room. J Occup Environ Hyg 9: 681–690.
21. Blachere FM, Cao G, Lindsley WG, Noti JD, Beezhold DH (2011) Enhanced detection of viable airborne influenza virus. J Virol Methods 176: 120–124.
22. Lindsley WG, Schmechel D, Chen BT (2006) A two-stage cyclone using microcentrifuge tubes for personal bioaerosol sampling. J Environ Monit 8: 1136–1142.
23. ISO (2007) Respiratory protective devices – Human factors – Part 1: Metabolic rates and respiratory flow rates. Geneva: ISO/TS 16976–1.
24. Tellier R (2010) Aerosol transmission of influenza A virus: a review of new studies. J R Soc Interface 6: S783–S790.
25. Weber TP, Stilianakis NI (2008) Inactivation of influenza A viruses in the environment and modes of transmission: a critical review. J Infect 57: 361–373.
26. Wein LM, Atkinson MP (2009) Assessing Infection Control Measures for Pandemic Influenza. Risk Anal 29: 949–962.
27. Brankston G, Gitterman L, Hirji Z, Lemieux C, Gardam M (2007) Transmission of influenza A in human beings. Lancet Infect Dis 7: 257–265.
28. Milton DK, Fabian P, Angel M, Perez DR, McDevitt JJ (2010) Influenza virus aerosols in human exhaled breath: particle size, culturability, and effect of surgical masks, April 18–20, Atlanta, Georgia USA. Emory Conference Center.
29. Lindsley WG, Blachere FM, Thewlis RE, Vishnu A, Davis KA, et al. (2010) Measurements of airborne influenza virus in aerosol particles from human coughs. PloS One 5(11): e15100.
30. Yang W, Marr LC (2011) Dynamics of airborne influenza A viruses indoors and dependence on humidity. PloS One 6(6): e21481.
31. Teunis FM, Brienen N, Kretzschmar EE (2010) High infectivity and pathogenicity of influenza A virus via aerosol and droplet transmission. Epidemics 2: 215–222.
32. Brown JD, Goekjian G, Poulson R, Valeika S, Stalknecht DE (2009) Avian influenza virus in water: Infectivity is dependent on pH, salinity and temperature. Vet Microbiol 136: 20–26.
33. ISO (2005) Ergonomics of the thermal environment-Analytical determination and interpretation of thermal comfort using calculation of the PMV and PPD indices and local thermal comfort criteria. ISO 7730.
34. ASHRAE Standard (2010) Thermal environmental conditions for human occupancy. ANSI/ASHRAE, Standard 55–2010.